
Mobile game KPIs, analytics & metrics every developer should be paying attention to
We’re living in a data-driven world, and today, measuring the right metrics are vital to a game developer’s success. Mobile game metrics provide game developers with key insights into their users’ behavior, offering a look into how users interact with the game. Simply put, in-game metrics let developers track and assess the success of their game. With access to usage, engagement, and business metrics, game developers have the necessary information needed to improve their app or game and therefore optimize it accordingly.
Top 5 mobile game KPIs
1. Retention rate is the percentage of users who continue engaging with your game over time and is typically measured at 30 days, 7 days, and 1 day after users first install the game. This metric helps developers understand exactly where within the game’s life cycle users begin dropping off.
2. Lifetime Value (LTV) estimates the revenue a single user generates through their entire lifecycle within a game. It’s a prediction of a user’s monetary value over time. LTV tells developers how good of a job they’re doing monetizing and retaining users.
3. Daily Active Users (DAU) reveals the total number of users who visit a game on a daily basis.
4. Average revenue per daily engaged user (ARPDAU) helps game developers understand how well their monetization strategy is working, whether it’s from ads, IAPs, or a mix of the two. ARPDAU shows how changes or events affect game revenue.
5. Effective cost per mille (eCPM) is the ad revenue generated per 1000 ad impressions. While most game developers think eCPM is strictly for the monetization side, this figure also represents buying power when it comes to acquiring new users.
User and usage metrics
User and usage metrics tell developers crucial information about their audiences, ultimately illustrating which sort of users your game appeals to. Developers can use this information to optimize and localize their game for a better user experience, as well as their user acquisition campaigns. Some examples include: DAU, MAU, Device/OS, Segmentation
Engagement metrics
Engagement metrics give developers insight into user behavior and how they’re engaging and interacting within a game. Once developers understand users’ interaction with their game, they’ll be able to improve functionality, retain a loyal user base, and optimize the monetization strategy. Example metrics include: Session duration, retention rate, churn rate, and app rating are some metrics developers have to determine engagement levels.
Business metrics
Business metrics ensure that developers are able to keep track of their monetization and user acquisition strategies, and provide granular data that informs business growth. The first step to examining business health is marketability. Marketability measures product-market fit, answering the question of whether or not there is a user base to actually download your game.
Once you’ve assessed marketability, consider other metrics like eCPM, ARPU, and LTV.
Looking for more tips on boosting monetization and user acquisition efforts? Check out our guide to in-game advertising.
Changing the game with ironSource reports
Below we walk through some of the most important, helpful reporting features ironSource offers mobile game developers.
Cohort reporting
A cohort is a group of users that perform a certain sequence of events within a particular time frame. Cohorts allow developers to analyze the behavior of groups of users as time progresses, giving them a complete picture of the lifecycle of their game.
With cohort reporting, developers can easily track metrics like retention, revenue per user, and user engagement from the moment the user downloaded and opened the app within the defined date range. Cohort reporting is equally as useful for both monetization and marketing efforts.

Looking to implement cohort reporting? Head to our developer center for more info.
How we helped Homa Games with cohort reporting
Hyper-casual publisher Homa Games didn’t have the technological resources to build their own reporting dashboard and were on the lookout for a partner that could provide robust and actionable data that would give them insight into their monetization performance.
Once Homa Games began utilizing ironSource’s cohort reports, they were able to instantly see the impact of the changes made to game design or ad monetization strategy. ironSource’s cohort reports immediately alerted Homa Games about a sudden drop in ARPU. Homa Games realized that some levels they had recently integrated into their game were too difficult, causing users from new cohorts to leave the game after only a few minutes. Thanks to the cohort report, they caught the problem quickly and implemented a solution.
Homa Games also uses the ARPU calculation within the cohort reports to calculate the perfect bid in order to improve their UA efforts. The result? A 9% increase in ROI.
User activity reports
Understanding user behavior is key to optimizing your monetization and marketing strategies. By utilizing user activity reports, you get access to valuable information and analytics that breakdown user activity and ad engagement through advanced metrics. In one report, you can see DAU, ARPDAU, and sessions/DAU for each game, ad unit, country, and ad source. Learn more about user activity reports here.
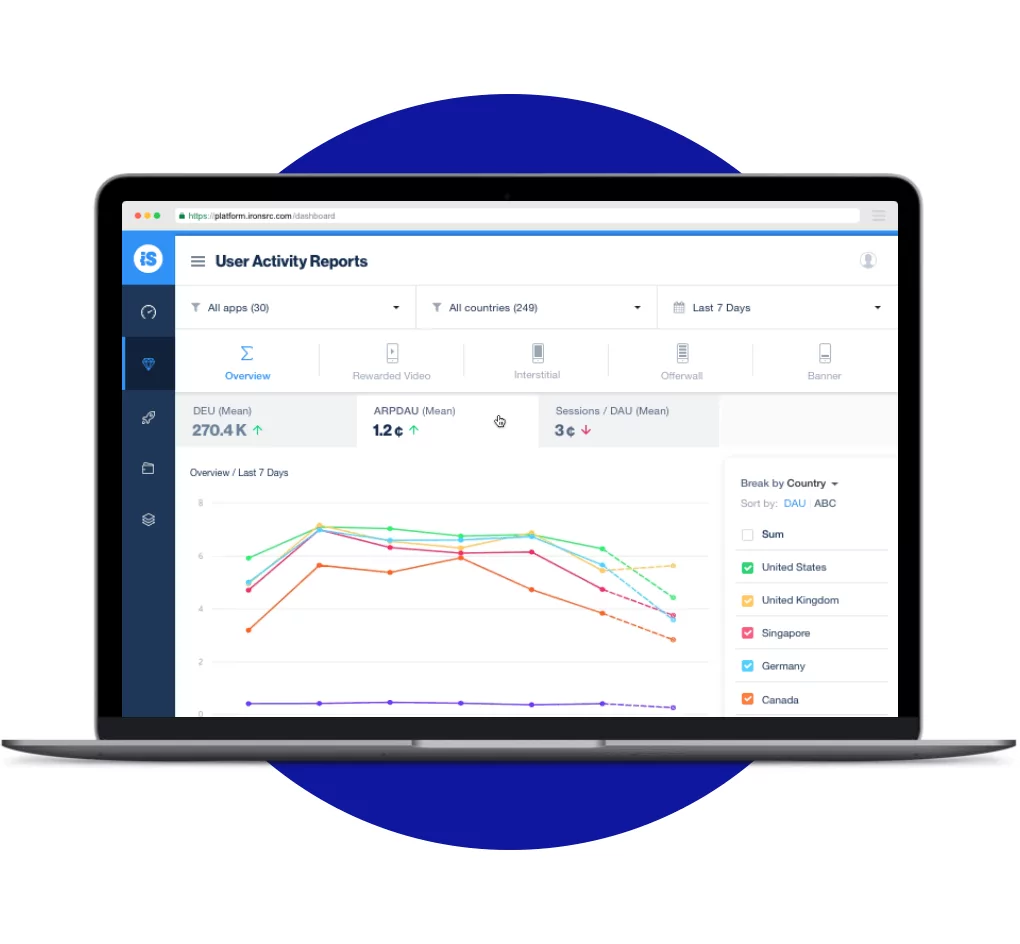
Mobile game publisher Random Logic utilized user activity reports to analyze ARPDAU and engagement rates, remarking, “it’s a great report to know if your current strategy or testing is effective.”
We’re living in a data-driven world
Without access to data, developers today would be unable to track and understand their user base. From engagement metrics to business metrics, and just about everything in between, developers today have access to a wealth of data that will ensure that they make smarter business decisions.


