
The mobile app ecosystem has proven itself to be both a prosperous and lucrative industry. With more than 3.4 billion smartphone owners worldwide and 175 billion app downloads last year alone, this $950 billion industry serves consumers with all-encompassing abilities. We’ve compiled some of the top statistics in the mobile app ecosystem to highlight just how influential this ever-changing industry is.
Learn about notable trends, consumer engagement, and which countries take the reigns in expanding the flourishing industry.
App Economy Statistics: App Stores and Downloads
1. According to AppAnnie, worldwide app downloads amount to 205.4 billion in 2018 and are expected to grow at a 7.7% CAGR rate from 2017 to 2022.
2. App stores, including Google Play, Apple’s App Store, and third party platforms, offered over 7 million apps across devices in the first quarter of 2018. Click to tweet!
3. As the leading app publisher, Google Play has over 3 million apps and 968K app developers, while Apple’s App Store has 2.2 million and 498K publishers.
4. Worldwide app downloads grew 13.5% from 81 billion to almost 92 billion from 2016 to 2017.

Source: SensorTower
5. Downloads in both App Stores continue to steadily grow with a 10% increase YoY from Q1 2017 with 27.5 billion downloads in Q1 2018.
6. During the first quarter of 2018, Google Play exceeded 19.2 billion downloads, whereas iOS downloads surpassed 8.2 billion. Google Play’s more pronounced growth is likely attributed to Android’s high adoption rate in developing countries.

Source: AppAnnie
7. Gaming apps are the most popular category in the Apple App store, making up almost 25% of apps, while educational apps were the most popular for Google Play in Q1 2018.
8. Augmented reality games make up less than 1% of total game downloads on both iOS and Google Play, at 3,000 games out of 1 million gaming apps available.
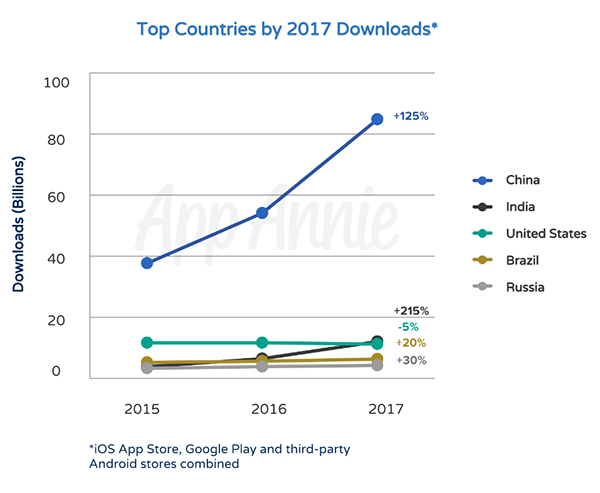
9. From 2015 to 2017, China saw a 125% increase in downloads, strengthening its spot as the dominant regional market. India, which saw a 215% increase in downloads and app usage due to unlimited 4G access, exists as the second largest regional market. The U.S., which makes up the third strongest regional market, and saw a 5% decrease in downloads during these two years.

Source: AppAnnie
10. Along with downloading from iOS App Store, China’s gaming market thrives with over 400 Android App Stores, including China’s most popular Android App Store, Tencent MyApp, which holds 25% of China’s Android app market, 360 Mobile Assistant with 15% of the market, and Xiaomi App Store with 11% of the market.
11. China’s app market prevails with 97.36 billion downloads in 2018, which is over 5x as many downloads a the second leading market, India, with 18.11 billion apps, and the U.S. with 10.94 billion.
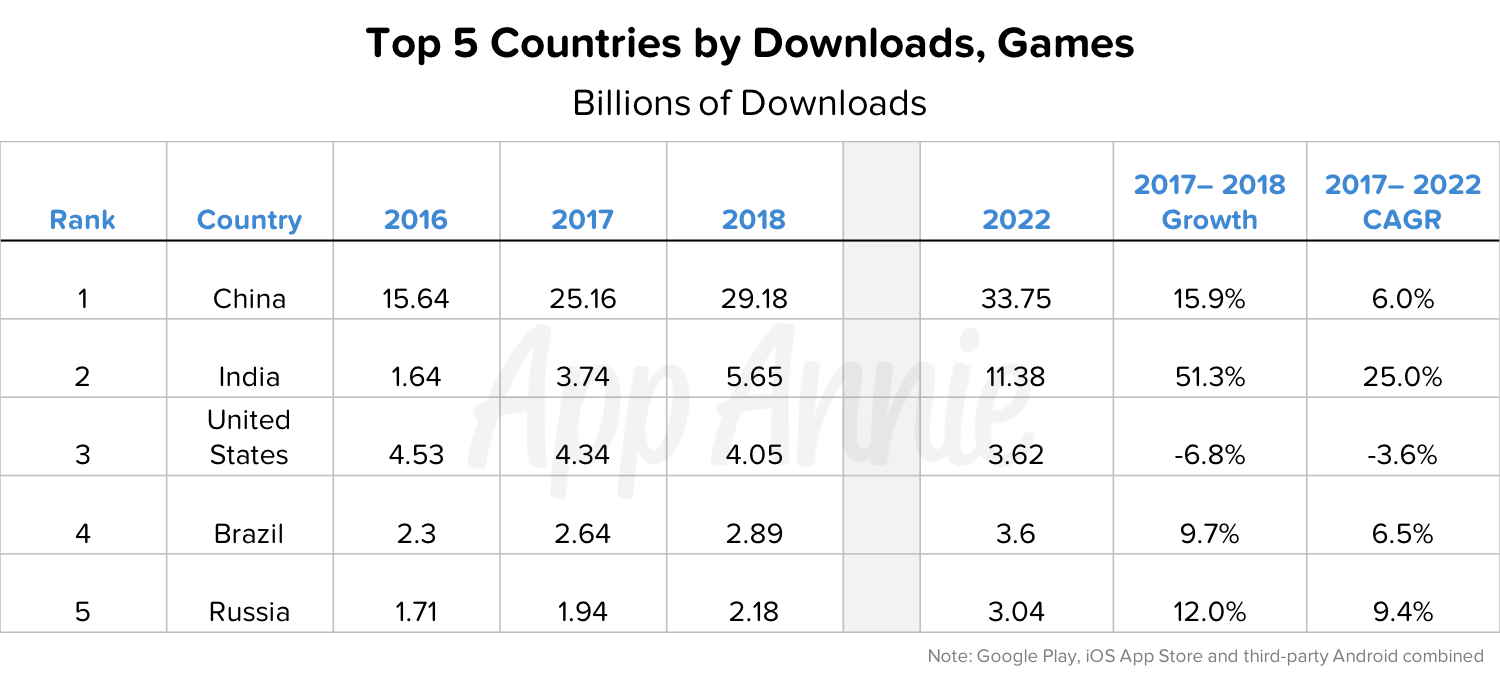
12. In 2018, Chinese gamers downloaded about 6x more games (29.18 billion) than Indian gamers (5.65 billion) and U.S. gamers (4.05 billion).
App Economy Statistics: Consumer Behavior
13. In 2017, App Annie reported that smartphone users spent about 3 hours in apps every single day. Click to tweet!
14. Apps account for over 80% of time spent on mobile devices (smartphone and tablet).
15. Social media apps are most frequently used (39%) followed by gaming and messaging apps tied for second place (10%), and then retail apps (7%).
16. In the first quarter of 2018, 47% of total transactions were completed in apps and m-commerce is expected to amount to 39.6% of total ecommerce revenue in 2018.

Source: eMarketer
17. Generally, consumers spend 7x more time in native apps and use them 13x more often than mobile browsers.
18. Globally, 56% of mobile users game 10+ times a week and their time spent in apps has increased 30% from 2015 to 2017. Click to tweet!
19. The worldwide gaming population exceeds 2.1 billion gamers.
20. Games have a wide user base as, in 2017, the bulk of gamers were 25-44 year olds and 63% were female.
21. A recent study by NewZoo covering three prominent gaming markets, the U.S., UK, and Germany, found that 95% of gamers play mobile games, and men are more likely to spend money on apps than women.
22. Based on 2017 data, China has a gaming population of around 598 million users, while India has 264 million gamers and the U.S. has about 203 million gamers.
23. In most markets, the average smartphone user has more than 80 apps on their phone, and uses close to 40 of them per month.
24. In China, users have the most number of apps installed (approx. 100) and use less than half of them (approx. 40). India’s smartphone owners use the most apps (a little over 40) and install around 80.

Source: AppAnnie
25. In the US, 32% of gamers prefer using mobile devices than other consoles and spend about 23 minutes on gaming apps per day.
26. Chinese app users spent over 200 billion hours in apps across all stores in Q4 2017, which is over 3x more hours than India, where app users spent about 50 billion hours in apps, and the U.S., where users spent a little over 30 billion hours.
App Economy Statistics: User Acquisition & App Marketing
27. 82% of app users never look below the top 25 search results in app stores.
28. 30% of users download the app ranked #1 in a specific category, 17% download the app ranked #2 and 12% download #3. Apps #10 on the list or lower are downloaded by almost 0% of users.
29. More than 65% of app downloads come from organic searches.
30. Enjoyment is key to monetization - 20% of paying gamers are motivated to pay to show their support for the game developer.
31. 44% of mobile gamers agree that they prefer to see more loyalty and reward programs offered for in-game payments as a way to improve their experiences.
32. 75% of publishers view rewarded video ads as the most effective monetization strategy and 73% of gamers claim they don’t mind the ad-funded model of games.
33. Rewarded video ads are 53% more likely to be described positively by a gamer than interstitial video ads. Click to tweet!
34. Gamers who view rewarded video are 23% more likely to purchase the advertised product than those who view interstitial video and 18% more likely to make in app purchases.
35. Apps convert users 3x more than mobile web users do.
36. 19% of users have experienced payment fraud while gaming.
App Economy Statistics: Revenue and Advertising Spend
37. Mobile ad spend accounts for about 51% of digital ad spend - $72.5 billion in 2016.
38. Consumer spend in app stores exceeded $86 billion in 2017, with in-app purchase revenues making up $37 billion. Click to tweet!
39. Consumer spend in Q1 2018 surpassed all past records as global iOS and Google Play consumer spend increased 22% YoY to $18.4 billion.
40. In 2018, consumers worldwide spent the most in the iOS app store, $53.07 billion, followed by Google Play at $26.96 billion, and China’s third party Android platforms not too far behind with $26.42 billion.
41. Chinese smartphone users have spent the most on games, so far, in 2018, spending $34.43 billion, followed by Japanese gamers with $14.36 billion and U.S. gamers with $13.03 billion.
42. App Monetization in top markets continues to climb as consumer spend is up 270% in China from 2015 to 2017, and about 60% the U.S. as well as in Japan.
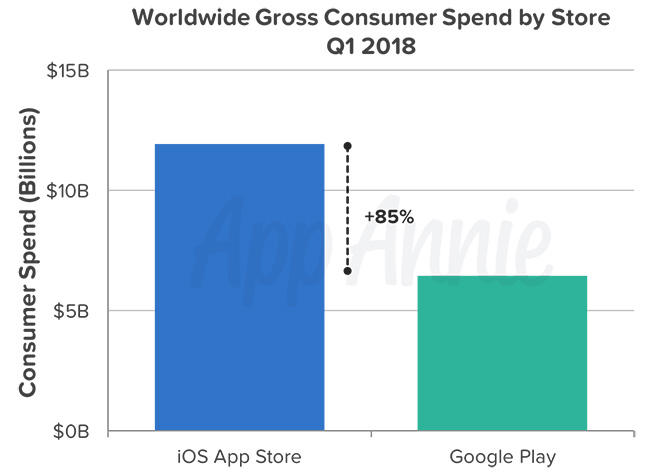
43. Worldwide consumer spend on Google Play grew 25% in Q1 2018 to over $5 billion while iOS only grew 20%. Nevertheless, in terms of consumer spend, iOS remains in the lead with over $10 billion.
44. Asia accounted for over 60% of gaming spend in 2016.
45. South Korea, Japan, and Taiwan saw a drastic increase in UA activity and downloads up 37% in 2017.
46. By country, China drives the market with almost $44 billion in consumer spending predicted throughout 2018.
47. Average revenue per user in the top 3 countries is as follows: China at $38.49, Japan at $90.57, and the U.S. at $56.72.
48. Total consumer spend in gaming Apps in China’s iOS store increased 250% from 2015 to 2017, where the mobile market was worth $12.1 billion.
49. China earned $1.7 billion in Q3 2016 through iOS App Store revenue, placing it 15% ahead of the U.S, and its gaming market worth is expected to double by 2022.
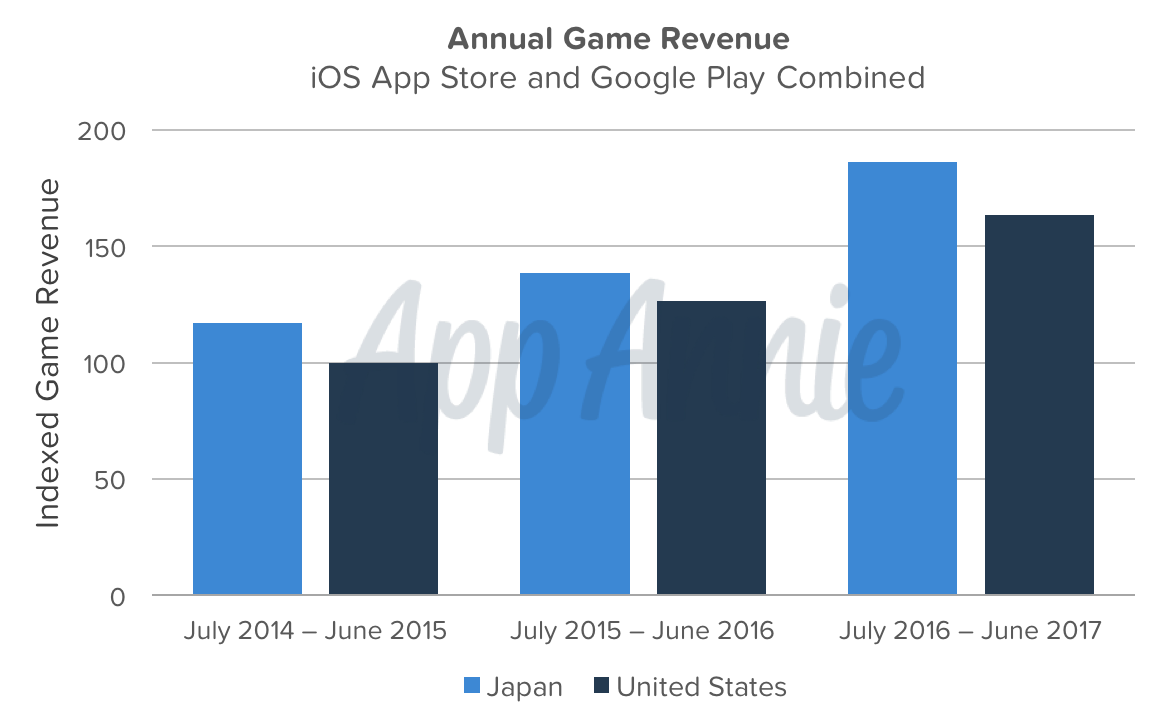
50. Japan’s mobile gaming revenue, from both iOS and Google Play, continues to rise and surpass that of the U.S., as it rose 35% in June 2017.


